



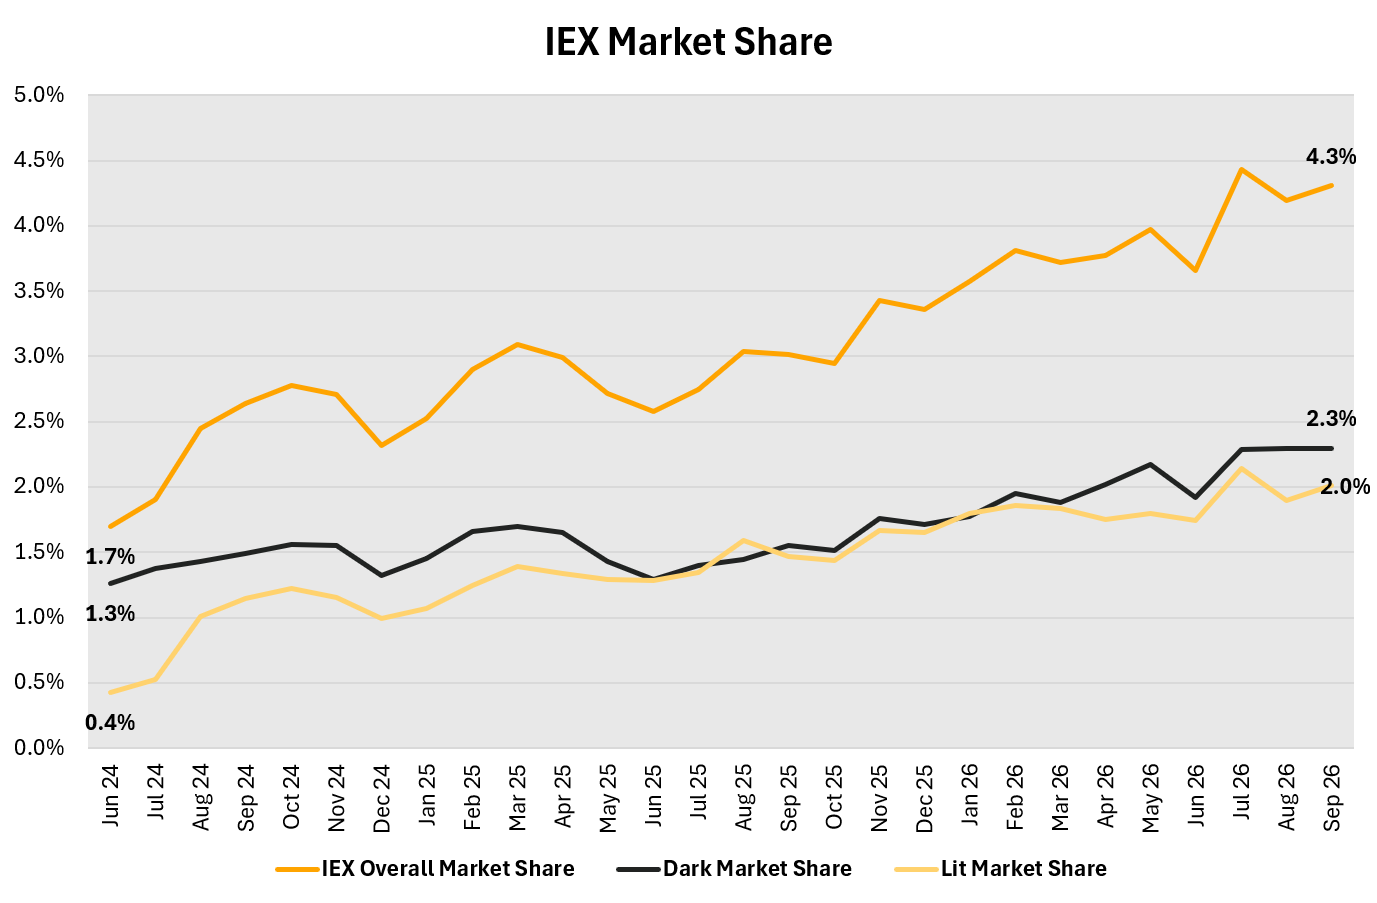
• IEX’s overall market share has reached new highs this summer, surpassing 4%, and making IEX the fourth-largest U.S. equities exchange. Growth has spanned both displayed and non-displayed trading.
IEX’s overall market share has grown significantly over the past year, increasing from 2.75% in July 2025 to 4.43% in July 2026. That represents more than 60% year-over-year growth and has catapulted IEX to the fourth spot among all U.S. equities exchanges by market share.
But for firms that use market share as an input into routing decisions or performance measures, IEX’s headline number only partially tells the story. The more relevant question is how much liquidity IEX represents within the parts of the market your algos are trying to access.
The same principle applies across displayed and dark trading. If market share influences how much you route to a venue, it’s worth looking at IEX’s share of specific liquidity your strategy is trying to access.
Growth Has Come From Both Lit and Dark Trading
That growth has not come from just one source of liquidity. IEX has gained significant share across both displayed and non-displayed trading. The result is a more diverse pool of liquidity, rather than growth concentrated in midpoint or other non-displayed executions.
Not All Market Share Is Created Equal
Headline market share blends on-exchange and off-exchange activity, regular-hours and extended-hours trading, auctions, sub-dollar securities and other forms of volume. But not all of that activity is equally relevant to an institutional trader.
For a broker’s algo executing throughout the regular trading day, pre-market volume or trading in sub-dollar securities may simply not apply to how that strategy trades. A more focused measure of intraday trading can better reflect the liquidity that algo can actually access.
That’s why institutional equity algos may be better served by looking at Institutional Market Share. IEX defines it as its share of on-exchange volume in securities priced above $1 during regular trading hours, excluding segments like pre-and post-market trading and sub-dollar securities.
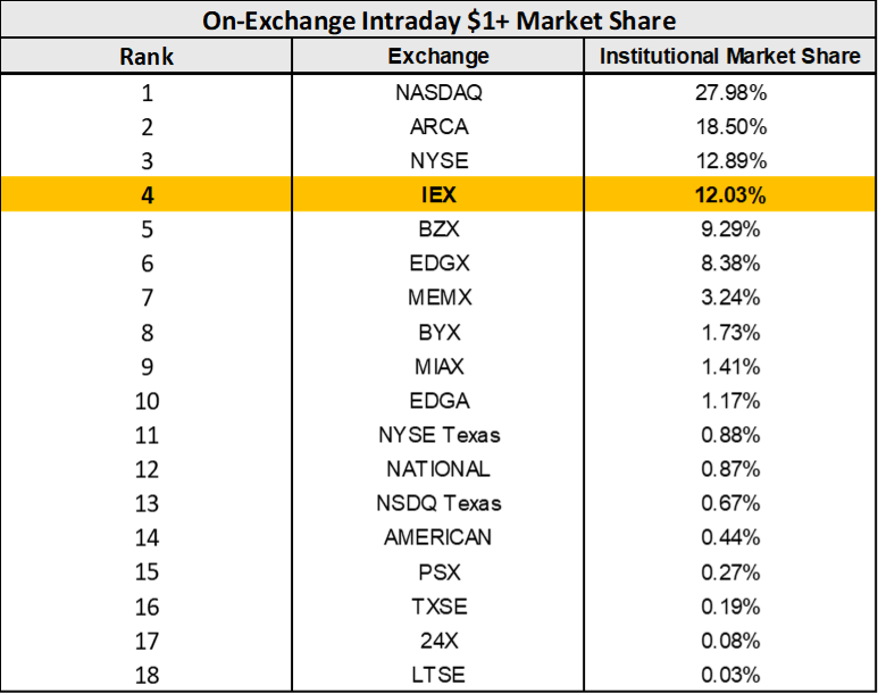
By this measure, IEX has clinched over 12% of market share, greater than the combined share of the bottom 12 venues.
Let’s drill down further.
IEX’s Displayed Market Share
IEX’s overall displayed market share grew 5x since June 2024. When focusing on displayed volume at the NBBO in symbols above $1, IEX reached over 9% market share among exchanges in July alone.
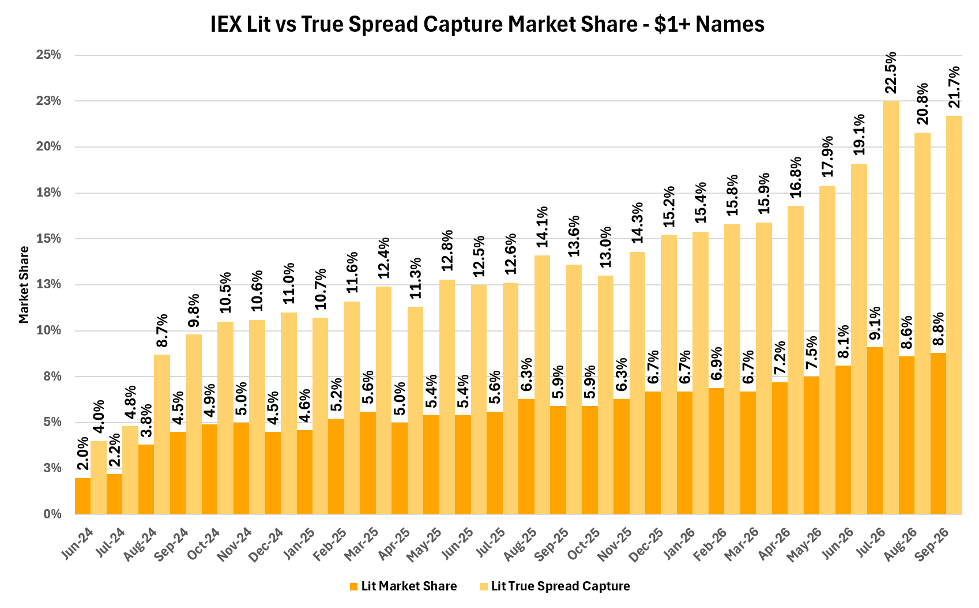
Source: IEX Market Data, NYSE TAQ. June 2024-September 2026. September MTD: 9/1-9/14.
Much of the increase has come from delivering true spread capture -- stable trading at the NBBO -- with IEX gaining share across both single stocks and ETFs.
This summer, IEX had the largest share of true spread capture volume at the NBBO among U.S. equities exchanges, accounting for over 20% of that volume in recent months. When isolating for ETF volume, IEX reached 24% in July.
A major factor behind IEX’s displayed growth is D-Limit, which leverages the Signal4,and is designed to protect against unfavorable price movements.
D-Limit is the only displayed exchange order type designed to provide pre-trade price improvement, while also helping market participants achieve genuine spread capture by reducing exposure to unfavorable price moves.
IEX’s Non-Displayed Market Share
IEX’s growth isn’t limited to displayed trading. As non-displayed trading has become a larger part of the market, IEX’s dark liquidity has expanded as well. Key drivers of this growth include recent enhancements like the Ultra Passive Signal, as well as an updated Signal, and longstanding protections such as the Speed Bump.
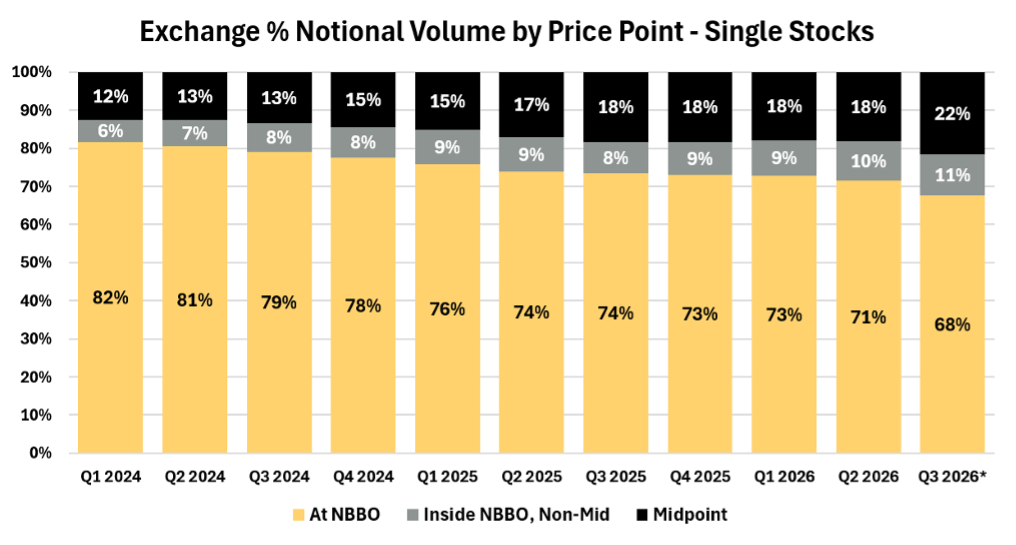
In this analysis, “Inside NBBO, Non-Mid” and “Midpoint” represent non-displayed executions.
In Q1 2024, over 80% of on-exchange single-stock volume traded at the NBBO. Fast forward to July 2026, that share has decreased to 68%, with a notable migration away from displayed trading at the NBBO toward non-displayed executions.
As more on-exchange trading moves from lit markets to dark, IEX represents a larger share of that available dark midpoint liquidity.
In recent weeks, IEX has led exchanges in overall midpoint trading. In July, IEX had the highest notional midpoint market share among exchanges for single stocks, accounting for more than one-third of all on-exchange midpoint notional volume. For stable midpoint executions, IEX’s share increased to nearly 40%.
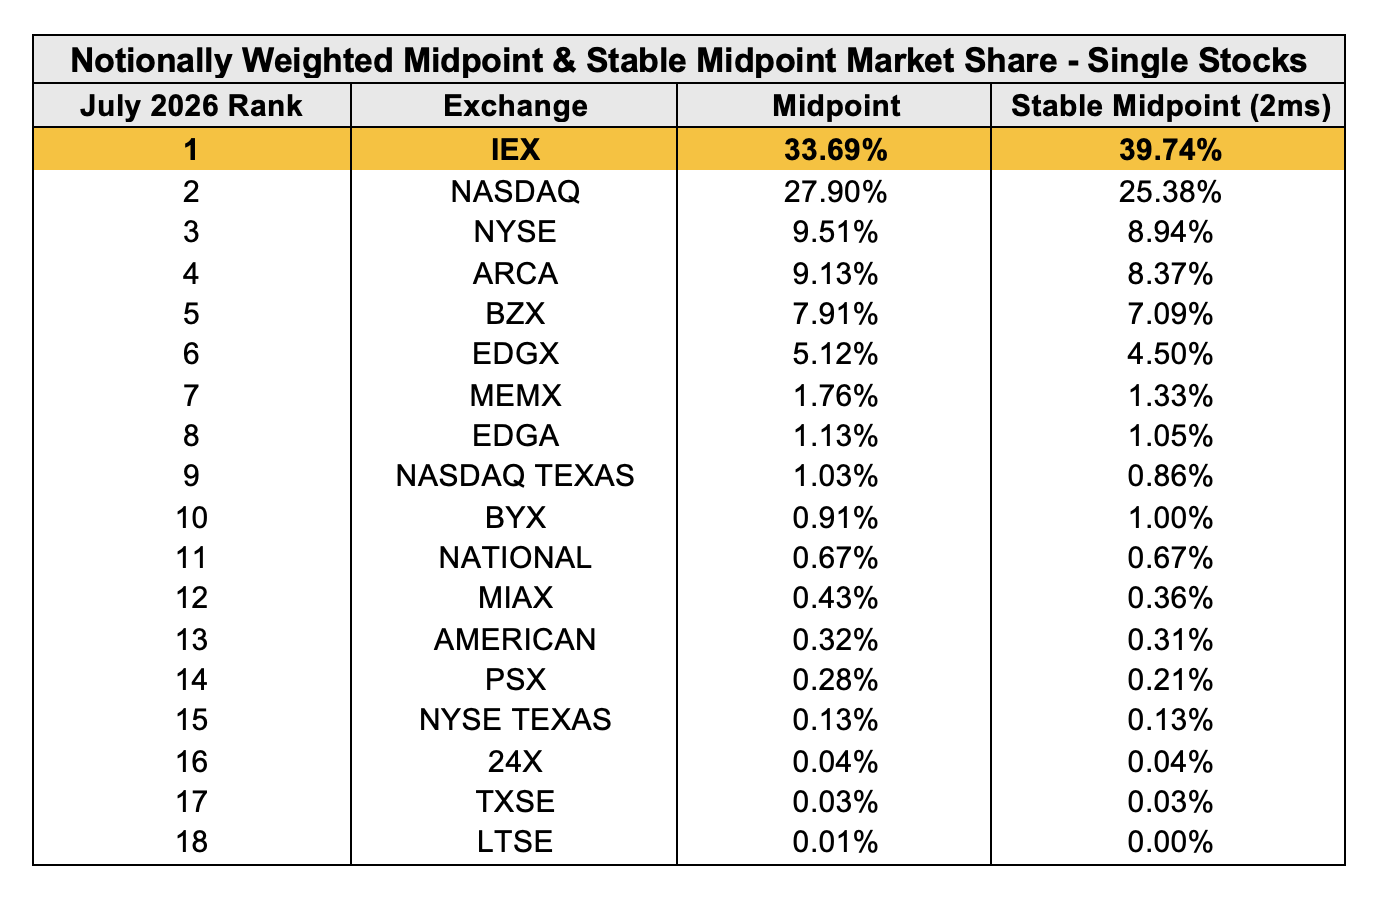
Note: “Stable midpoint” is defined as midpoint executions where the NBBO midpoint remains unchanged 2ms after trade.
IEX Is the Largest Single-Stock Midpoint Venue
Clients source midpoint liquidity across both exchanges and ATSs, so looking only at exchange market share leaves out a significant part of the competitive landscape.
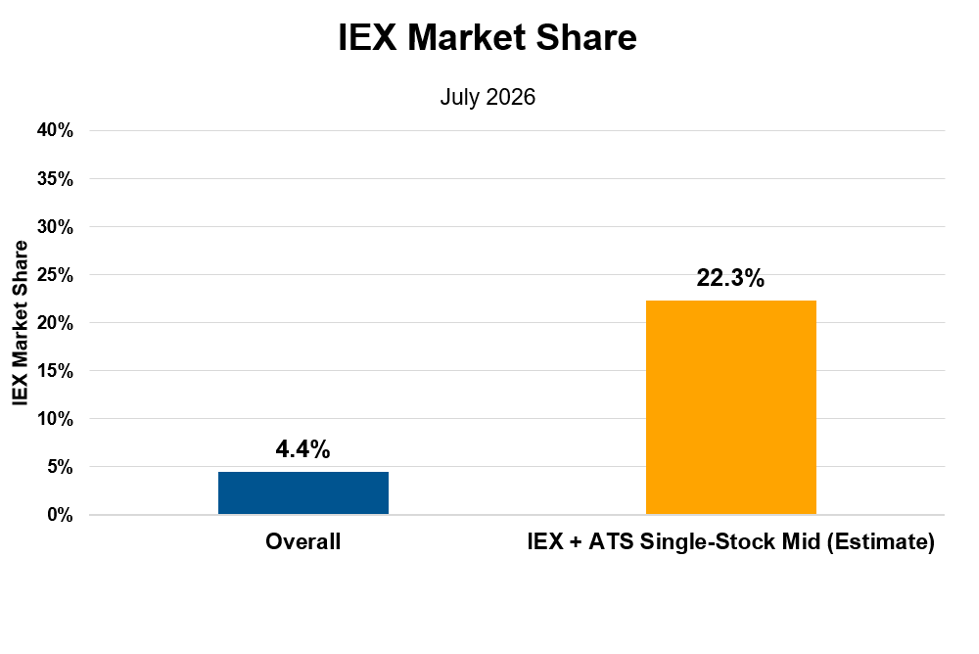
IEX is the largest exchange for single-stock midpoint volume. Compared with individual ATSs, IEX ranks first there, too. Based on our estimate, IEX accounts for over 22% of the combined IEX and ATS single-stock midpoint pool, making it the largest single-stock midpoint venue across both exchanges and ATSs.
Are Your Routing Settings Keeping Up?
IEX has grown, and that means even more liquidity available to clients across both displayed and non-displayed trading.
If market share is an input in your routing decisions, consider updating your routing tables to reflect where IEX stands today. If you’re not consistently adjusting your settings, you may be missing out on IEX liquidity.
Reach out to your IEX sales representative or email bdteam@iextrading.com to learn more as you review your routing strategy.
1. IEX displayed volume as a percent of on-exchange volume at NBBO.
2.True spread capture refers to stable volume at the NBBO. Stable volume is defined as volume after which the NBBO did not change in the two milliseconds following a trade.
3. ATS midpoint figures are estimates for July 2026. The comparison is limited to single-stock midpoint volume, with IEX’s share calculated against the combined IEX and ATS single-stock midpoint pool.
4. IEX Exchange’s Signal (or Crumbling Quote Indicator) is designed to identify instances when the price of a security is about to change. The Signal fires when certain deterministic factors, as specified by rule, are met. IEX Exchange’s Signal does not always fire when a quote crumbles, and it may fire in instances when a quote does not crumble.
Timur Smirnov
Business Analytics