



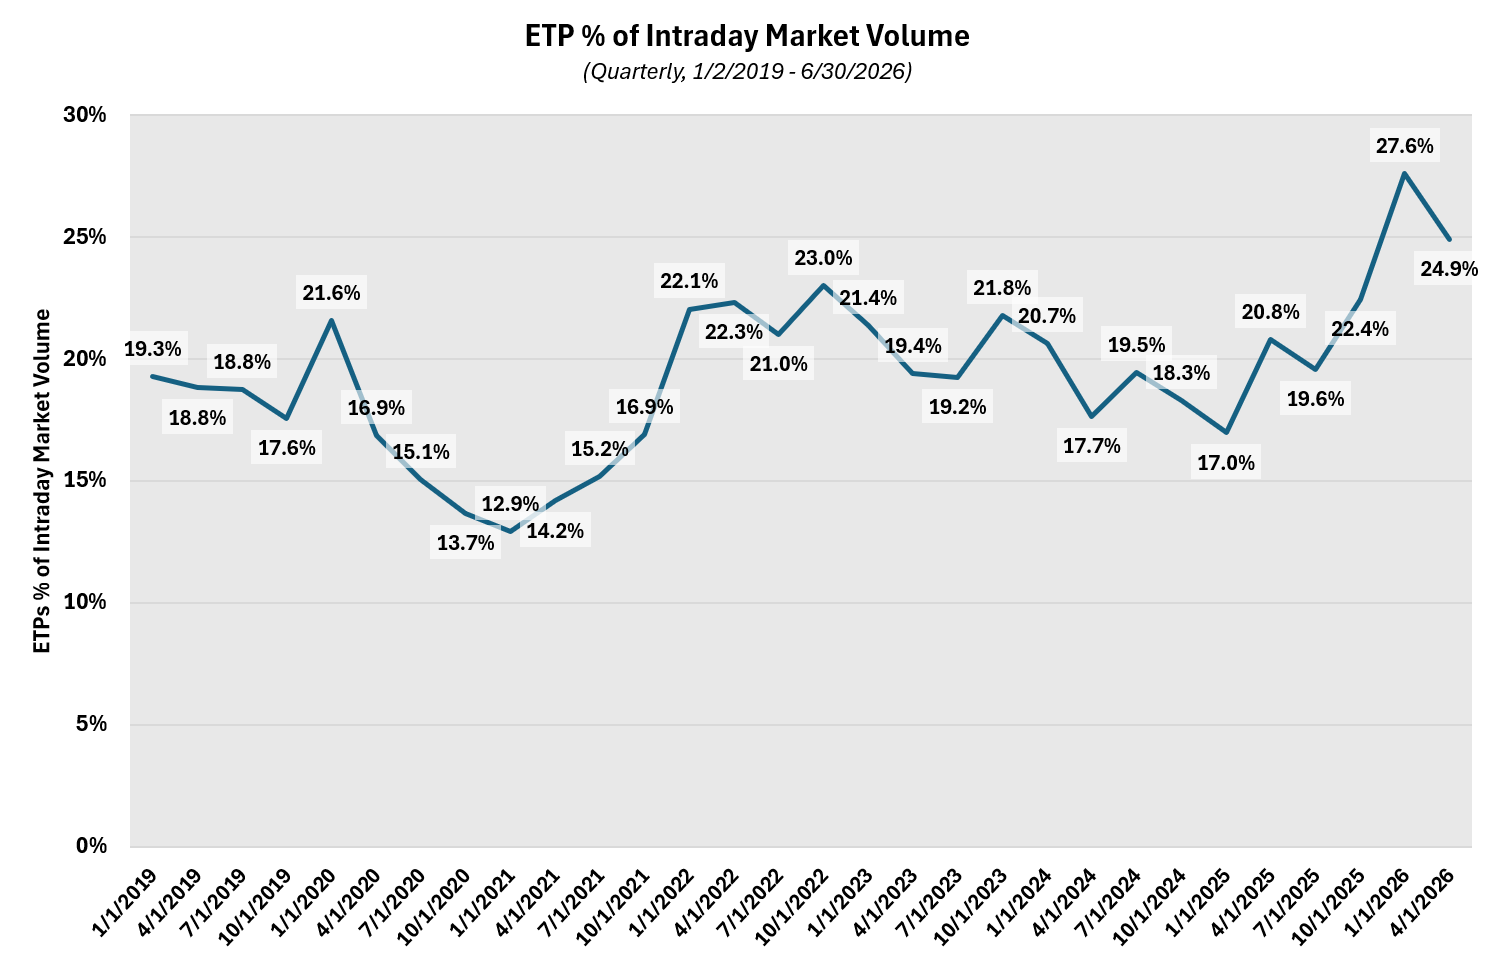
ETFs are taking up a larger share of market volumes than ever before. After fluctuating in the mid-teens to low-20% range over the past several years, ETF volume is consistently above 20% and recently set new all-time highs above 25%. One driver of this trend has been the continued expansion in ETF listings, which surpassed single stocks in 2025.
ETF trading growth hasn’t been evenly distributed across the market, but instead concentrated in a relatively small subset of highly liquid names. The top 10 ETFs by market volume account for roughly 27.5% of total ETF volume, while the top 20 account for roughly 38%.
Leveraged ETFs are a major driver of that concentration. They account for roughly 40% of total ETF volume, and seven of the top 10 most actively traded ETFs are leveraged. The top 10 leveraged ETFs represent nearly a quarter of all ETF trading activity.
Recent changes in market structure also illustrate how quickly ETF trading behavior can shift. In our analysis of the reintroduction of Section 31 fees, we found that the fee increase coincided with wider quoted spreads in many of the market's largest ETFs and a measurable decline in ETF trading volumes relative to single stocks. The impact was most pronounced in higher-priced ETFs, where Section 31 fees are higher, since they are assessed notionally. While the Section 31 fee change temporarily slowed ETF activity, the longer-term trend remains intact and IEX's share of ETF trading has continued to grow.
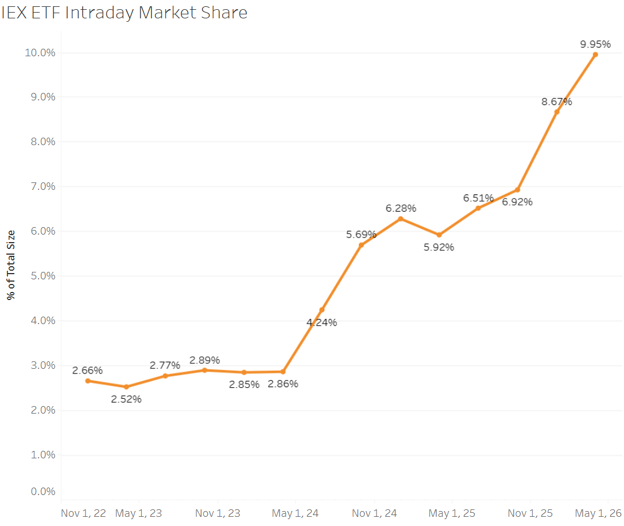
As of June, IEX now accounts for nearly 10% of intraday ETF volume on exchanges. This is up from roughly 2–3% just a few years ago. Our growth is even more evident on a product-by-product basis. In June, IEX was also the highest-volume exchange in more than 150 ETFs and ranked among the top three venues in over 1,500 ETF instruments.

An important differentiator for ETF trading on IEX is D-Limit, which is designed to help market participants reduce adverse selection during periods of rapid price movement. One way D-Limit's functionality shows up is in quote stability. In Q2 2026, IEX led all exchanges in ETF NBBO stability, with 86% of all ETF trades happening at the NBBO being stable** compared to 36% on other exchanges.
If you’d like to better understand how IEX is differentiated in ETF trading, we’re always happy to connect at bdteam@iextrading.com
* Excluded exchanges with <2% market share
** Stable volume is defined as volume after which there was not an NBBO change in the 2ms following a trade. Stability comparisons made on volume taking place at the NBBO.