
Part 1 in the lifecycle of an order.

Part I
Post-trade: D-Peg markouts vs. near-side displayed orders
Trading is endlessly complicated, but there is one simple truism that virtually everyone in the field can agree on: buy low and sell high.
It seems obvious.
And following from that rule, buying on the bid should always be better than buying at the midpoint of the NBBO. The best price is the lowest when buying and the highest when selling.
The problem is, that’s not categorically true.
In this series, we’ll look at the three parts of the lifecycle of an order — pre-trade, trade, and post-trade — in order to examine why in certain circumstances buying high and selling low gets you the winning trade in the end.
Starting at the end
In Part I, we use markouts [1] — a generally accepted metric for post-trade performance — to compare D-Peg trades on IEX to displayed limit order trades on rebate-paying exchanges,[2] using Nasdaq as a proxy (as the single largest exchange venue).
For example, if you buy stock for $50.10 and see the price fall to $50.05 shortly thereafter, you would generally consider that a bad trade because you overpaid relative to the prevailing market price. If you had just waited for a very short amount of time, you could’ve purchased the stock for cheaper.
Comparisons like this can be noisy for any single trade, but over hundreds, thousands, or millions of trades, the noise of any one particular measurement is drowned out by the other observations, leaving a robust figure for the average expected value of a trade.
Post-trade price changes
At face value, you’d expect markouts to support the conventional wisdom that trading at the bid or offer of the NBBO is better than trading at the midpoint. Consider the possible ways the price could change after a resting buy order is executed:
1. Post trade the NBBO doesn’t change
- Buying the bid: Positive ½ spread markout
- Buying the midpoint: Zero spread markout
2. Post trade the NBBO moves against you one spread (down for buys\, up for sells)
- Buying the bid: Negative ½ spread markout
- Buying the midpoint: Negative 1 spread markout
3. Post trade the NBBO moves in your favor one spread (up for buys\, down for sells)
- Buying the bid: Positive 1.5 spread markout
- Buying the midpoint: Positive 1 spread markout
Notice that in every scenario here, the near side trade has more upside or less downside.
So… case closed. Right?
Making up a head start
Yes, a trade at the bid or offer has a head start of half the spread over a trade at the midpoint. But the data actually shows that this head start can be short lived — measured in microseconds or milliseconds.
In reality, for a very large percentage of cases and on average, the outcomes for trades at the bid or offer are very different than the outcomes for midpoint trades on IEX using D-Peg,[3] allowing midpoint trades to not only make up that head start, but actually end up with better results very quickly.
The truth is in the data
Below we quantify the performance differences between D-Peg and displayed orders at the bid and offer (near side of the NBBO) using post-trade markouts.
For comparison, we look at Nasdaq near-side orders (using order-by-order data) and compare them to D-Peg orders on IEX, specifically looking at orders we believe are representative of typical investor behavior.
For both data sets:
- We look at orders sent between 9:30 a.m. and 4:00 p.m.
- We exclude orders added within 1 millisecond of the near-side price level’s formation, in an effort to remove market-makers from the dataset.
For both sets of orders, we consider those that executed within 3 minutes[4] and compare their execution price to the midpoint of the NBBO at a series of time intervals after the trade, focusing in particular on results 1 second after the trade.[5]
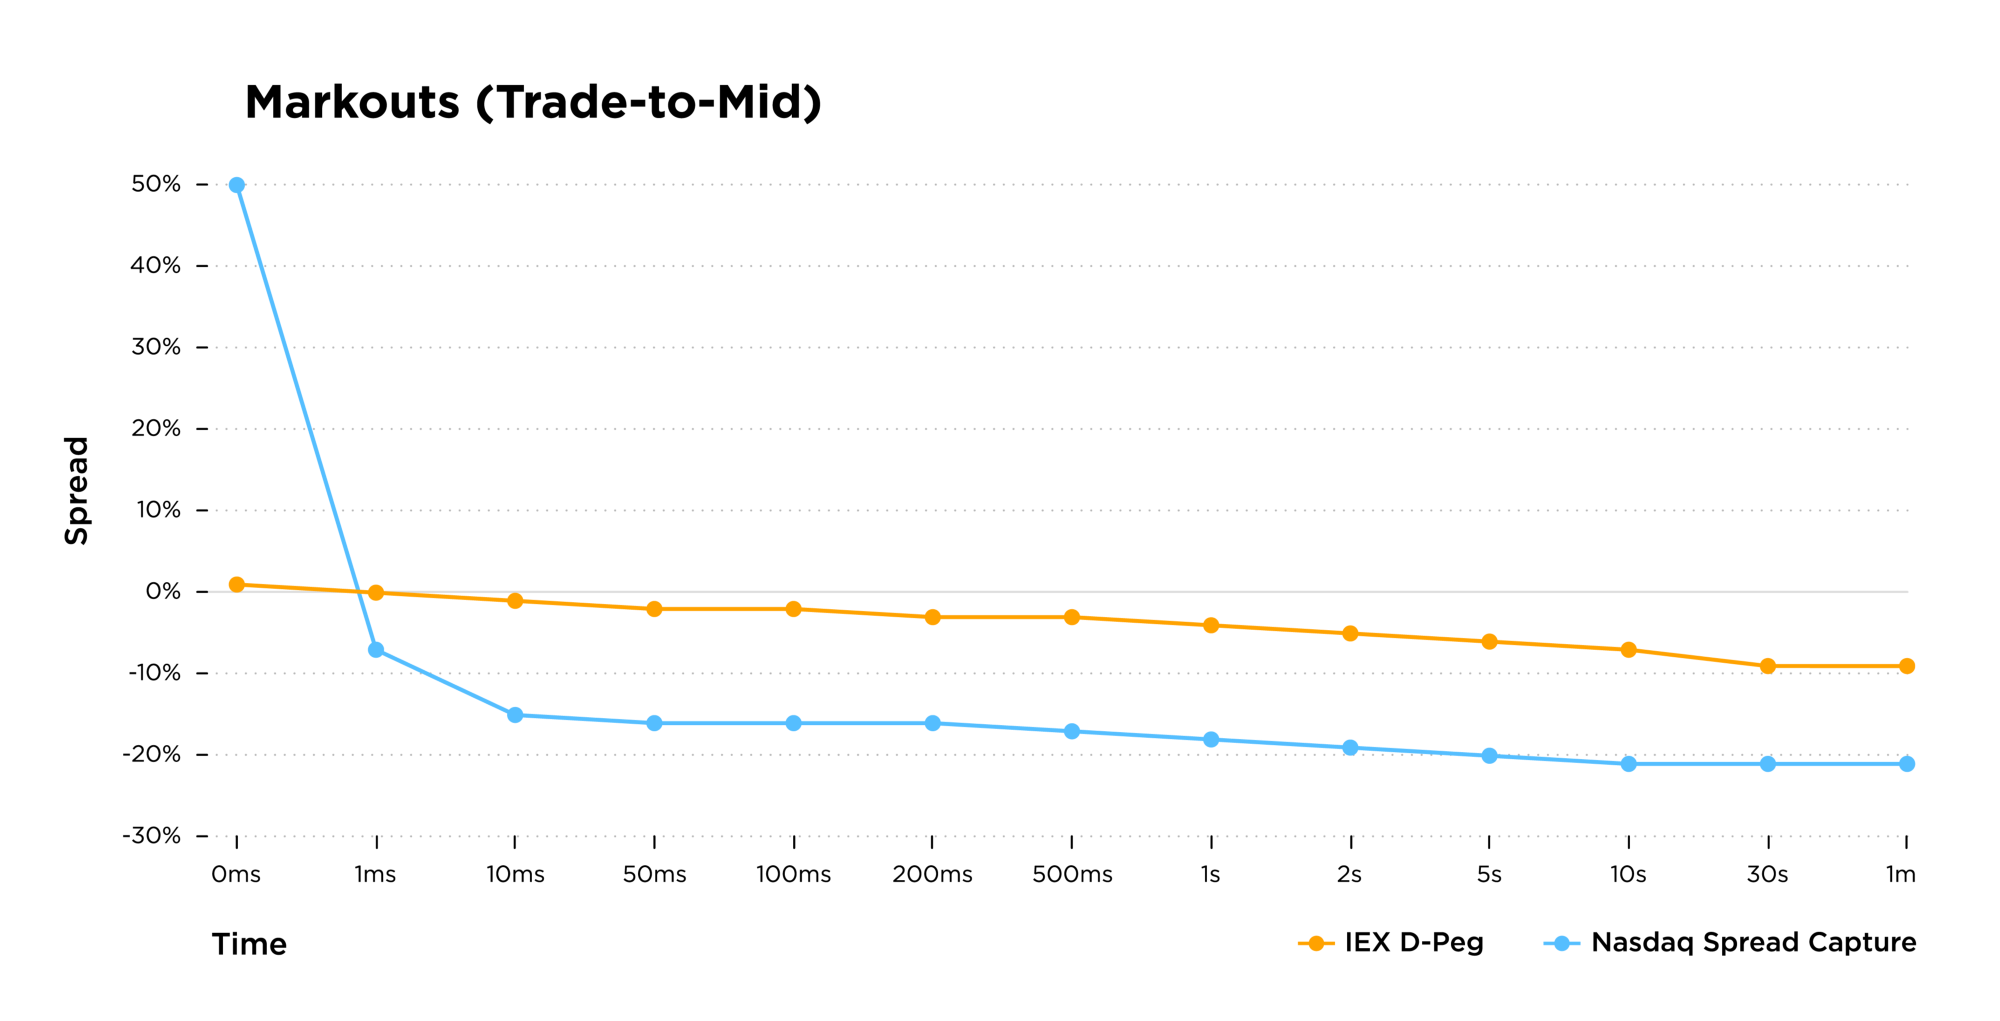
For the month of October 2019, there were 57,772,991 trades on Nasdaq and 14,314,088 D-Peg trades on IEX that fit our criteria. 15% of near side orders and 36% of D-Peg orders that rested at least 1 second received fills.[6] The near side trades had an average 1-second markout of negative 1.10 bps or -18% of the spread and the D-Peg orders had an average markout of negative 0.29 bps or -4% of the spread.[7]
The takeaway
The D-Peg trades outperformed the near side trades by 0.81 basis points (14% of the spread), *even though they started at a disadvantage of half the spread.* Despite a better starting price at execution, the near side orders ended up worse off on average than the D-Peg orders after only 1 second.
What’s special about IEX’s D-Peg order type?
IEX’s D-Peg order type is a non-displayed pegged order that rests 1 MPV outside the NBBO and can exercise discretion to the near side or the midpoint when the price is stable.
For example, if the NBBO is $10.00 x $10.01, a D-Peg buyer is booked at $9.99 and can exercise discretion to trade up to $10.00 or $10.005 when the IEX Signal determines the price is stable and based on the seller’s price limit.
Because D-Peg can trade up to the midpoint (over 90% of D-Peg trades), it is often misunderstood as an aggressive order type and its midpoint fills are often seen as worse than those that execute at the bid or offer. However, D-Peg’s behavior is actually conservative when it comes to prioritizing good fills over bad fills. when it comes to prioritizing good fills over bad fills.
D-Peg is designed to provide a number of key advantages:
- Avoidance of pre-trade information leakage, e.g., it can float freely with the quote as a non-displayed order.8
- Its price can be accurately adjusted in response to quote changes because of the IEX Speed Bump.9
- It retains price improvement versus aggressive contras.
- It avoids adverse fills when the IEX Signal determines the price is unstable (i.e., when the IEX Signal is “on”).
As a result of these protections, D-Peg trades are high quality, making them more likely to have positive or less negative markouts than other types of trades. Additionally, because D-Pegs are willing to trade at a more aggressive price when the price is stable, it “jumps the queue,” improving fill and hit rates.
But that’s only part of the story
We now know that D-Peg trades perform better on average than displayed orders at the near side on Nasdaq, but a similar analysis can be done for any maker-taker exchange (which are the largest displayed trading venues). Please reach out if you are interested in more extensive data (e.g., markout comparisons by symbol or across exchanges). You can also read more about performance on maker-taker exchanges in the “Gone in Sixty Seconds” blog post.
In our next two parts, we’ll look at how D-Peg performs at the moment of the trade (retaining price improvement) and pre-trade (price improvement vs. arrival price).
[1] Markouts are typically measured relative to future NBBO midpoint prices, where the future can be expressed in units of time, or events in the market such as trades or volume. Future prices can be sampled at multiple periods, providing an evolutionary view of post-trade quality. For example, if side=‘Buy’ then 1*(future NBBO mid price — trade price), else -1*(future NBBO mid price — trade price), where ‘future NBBO mid price’ could be sampled at 1 second, 30 seconds, 3 minutes, etc. Markouts can be expressed in notional terms or normalized by spreads or basis points.
[2] Nasdaq, NYSE Arca, NYSE, Nasdaq PSX, BZX, and EDGX.
[3] Note that D-Peg orders can also trade at the near side when the contra party is priced more aggressively than the mid, these trades account for ~7.5% of D-Peg volume.
[4] The three-minute cutoff is designed to mimic an algo child order, after a certain amount of time resting without a fill it might need to cross the spread or increase aggression.
[5] We kept the horizon short to limit subjectivity on the quality of execution — buying an asset for a price that is higher than the prevailing price a moment later is less ambiguously bad than buying an asset and seeing the prevailing price drop 5 minutes later.
[6] Average hit rates may not be representative of individual market participants’ experiences. For example, if a user never cancels their resting orders, they will likely experience higher hit rates. The average is also impacted by orders that cancel prior to trading.
[7] In mils per share, Nasdaq was -34.2, and IEX was -11.9.
[8] Displayed orders at the near side have priority over D-Peg orders when the contra order’s limit is priced to the far, unlike a Mid-Point Peg that has price priority over displayed orders. This allows for the near-side orders at the NBBO to be removed while the D-Peg order is still resting, allowing the D-Peg order to potentially then execute at an improved price due to the favorable NBBO change.
[9] In securities with a single venue quoting at the inside, a tick does not need to be predicted; it can be observed “through” or “by” pegged orders which can be “picked off” when an incoming order is sent in response to a price change that hasn’t yet been seen by an exchange’s matching engine. At IEX, a 350 microsecond delay on all incoming orders helps to prevent this.
Eric Stockland