

Initial data shows differentiated performance in D-Limit trading
With the non-stop headlines on the growth of off-exchange trading and the record percentage of overall volume on the TRF, displayed on-exchange markets are at an innovation crossroads.
For more than a decade, exchanges have incessantly tweaked their pricing, apparently thinking that was the only way they felt they could differentiate themselves in displayed trading. These pricing models (which often include rebates) have not provided any material innovation to displayed trading. In fact, research[1] has concluded that after factoring in rebates, fees, and the post-trade market environment, net costs of trading are a wash across all venues. IEX has vocalized that we believe on-exchange rebates are not good for investors, but I want to set that aside here.
The point is that we now know that innovation in displayed trading — real innovation, not incremental changes in pricing — is possible. D-Limit is the proof.
D-Limit Delivers: A Head-to-Head Comparison of D-Limit and Other Venues
On October 1, 2020, IEX Exchange fully launched our Discretionary Limit (D-Limit) order type.
As a reminder, D-Limit behaves like a regular limit order, except when the IEX Signal (i.e., the Crumbling Quote Indicator or CQI) predicts that the price is about to change, which triggers D-Limit orders to automatically reprice 1 MPV (minimum price variant, $0.01 for most stocks) outside that level. The idea is for the order to avoid being “run over” when the price is unstable.
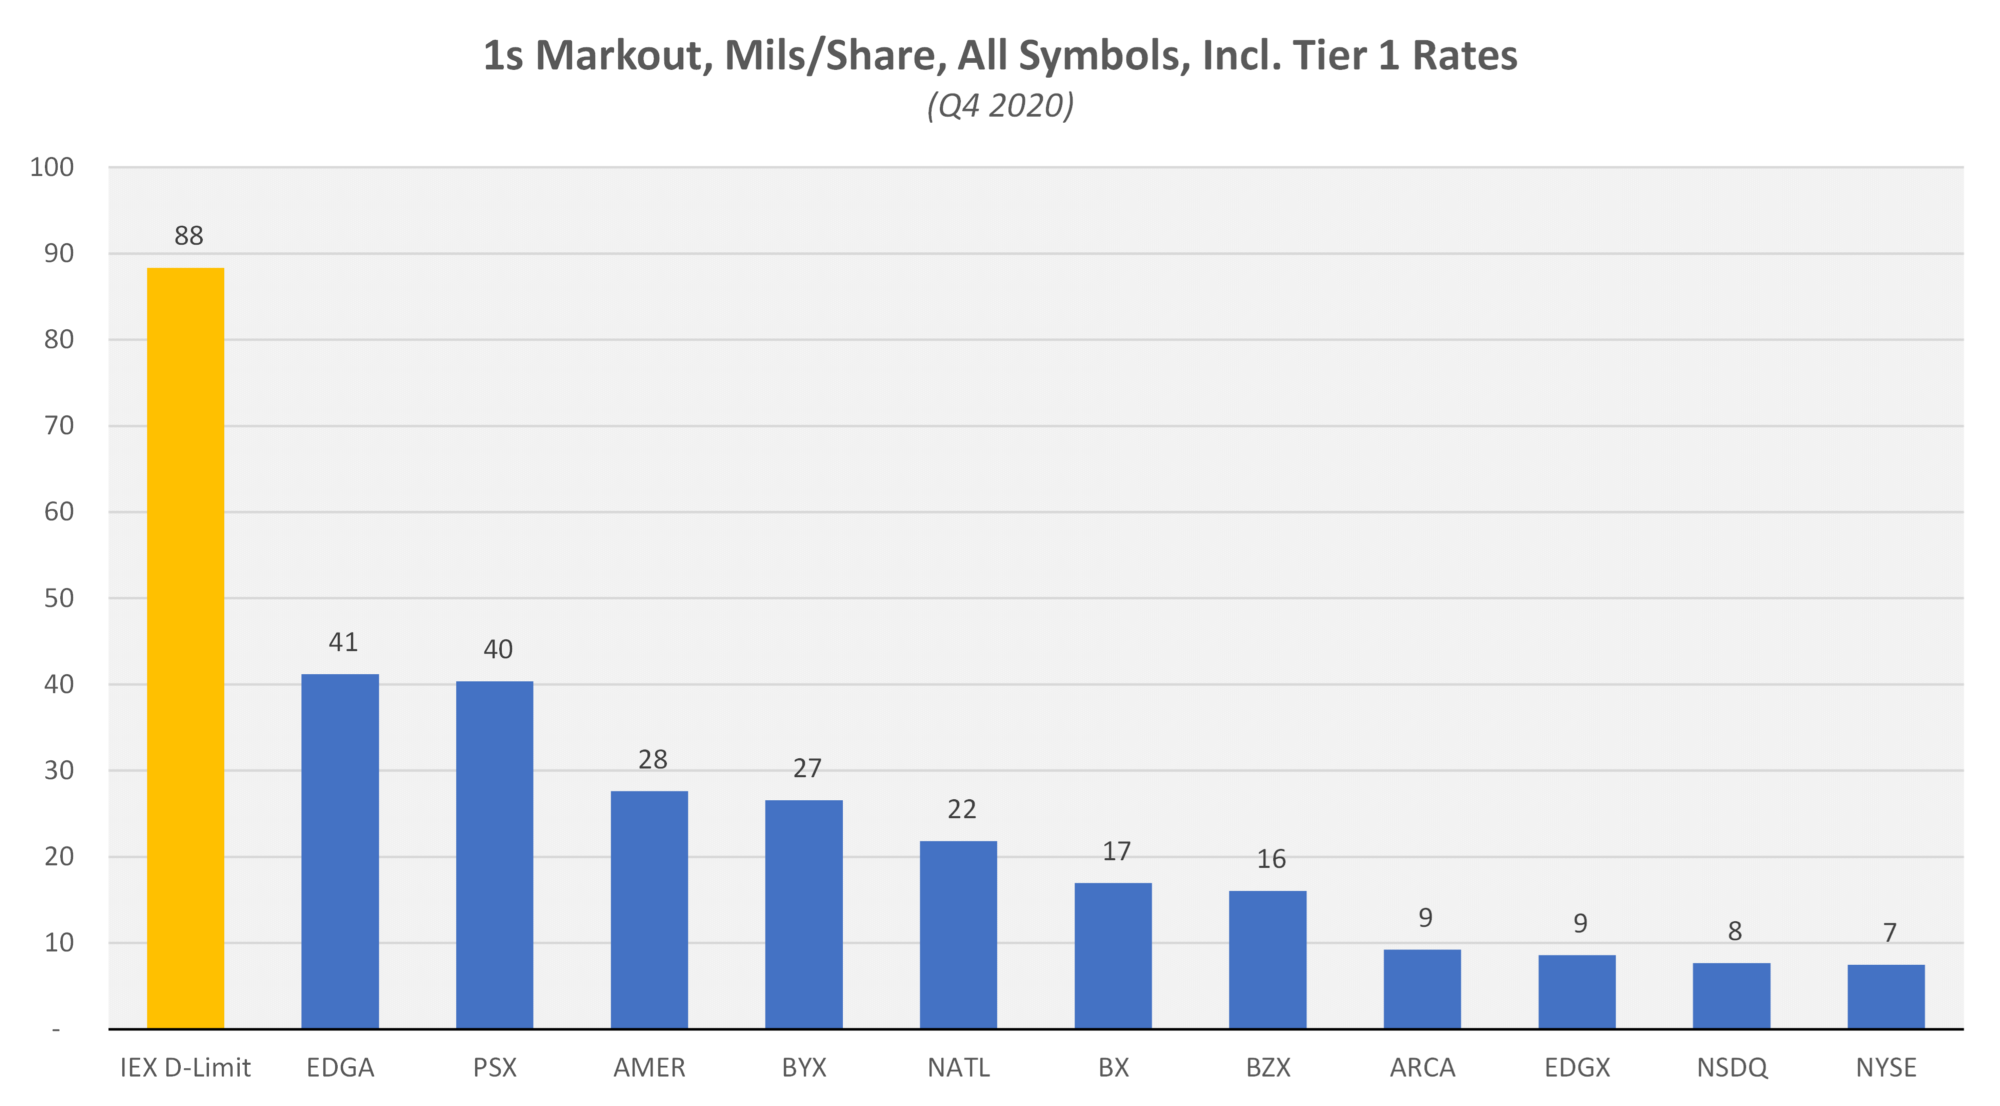
Since launch, the performance data we’ve collected on D-Limit shows that it is working as intended — it is delivering additional protection when the IEX Signal predicts the market is unstable, resulting in improved execution quality. To illustrate how well D-Limit is working, we decided to compare it to the performance on other exchanges using markouts. [2]
These results demonstrate a clear outperformance of D-Limit compared to other exchanges.

To do this analysis, we used NYSE TAQ data to identify executions occurring at the best bid or offer on each exchange (including IEX) to isolate mostly displayed orders.[3],[4] We then compared that to D-Limit trades we isolated using IEX Market Data,[5] calculated the markouts of each exchange, and inserted IEX D-Limit as a separate measurement. The above chart shows this analysis using a 1-second markout (a common time horizon), but our results hold across various time horizons, both short- and long-term.
We also wanted to factor in the fees/rebates of each venue, especially for the benefit of market participants who trade with “all-in” pricing (market-makers, cost-plus clients). For example, Nasdaq’s markout is -23 mils/share, but they also pay a rebate of up to 30.5 mils which needs to be taken into account.
This changes the picture slightly. When you add the tier 1 fees and rebates (i.e., the top-tier rates for adding displayed liquidity per the exchange fee schedules), the gap between the best and worst performing venues shrinks considerably, since rebates act as a kind of compensation for poor markouts. However, what doesn’t change is that IEX D-Limit appears to clearly outperform the rest.
Just as it was important to control for the rates various exchanges charge for executions, it’s also important to control for the types of stocks each venue trades. For example, if a given venue skews towards wider-spread names, markouts expressed in mils per share might have larger magnitudes. To do this, we repeated the analysis in percent of spread.
Here, we see that IEX D-Limit is one of the best-performing but is not quite at the top.

However, when controlling for trading costs, D-Limit jumps back to #1 as we take the cost to provide liquidity into account on the inverted exchanges (NATL, EDGA, BYX, and BX).

We are excited by these early observable D-Limit results and are further encouraged by the experience of those Members who have tried it. D-Limit has resulted in a significant volume jump for IEX because it offers best-in-class performance for our clients. The exchange trading space is highly competitive and has provided a slew of performance metrics that allow each exchange to claim itself the best. With these recent results, we believe that the performance benefits of D-Limit upend the economics of the rebate model and are a welcome departure from the usual trade-off between pricing and performance.
D-Limit gives our Members and their clients access to displayed trading performance that can be measured. Our analysis will not stop here: please stay tuned for my next blog which will discuss the hit/fill rates around this innovation. Feel free to reach out to me or your IEX contact with further questions or if you want to discuss testing D-Limit.
[1] Di Maggio, Marco and Liu, Jerry and Rizova, Savina and Wiley, Ryan, (June 12, 2020). Exchange Fees and Overall Trading Costs.
[2] To measure the impact of D-Limit on the performance of displayed orders, we used markouts, a common measure of execution quality. A markout calculates the magnitude and direction of a market move after you trade. Often, they compare the price at which a trade occurred to the midpoint of the NBBO at various points in time. For example, if you buy 100 shares at $10.00 and 1 second later the market is $10.00 x $10.01, you have a markout of 50 mils per share.
Often, markouts are used to measure adverse selection, or buyer’s remorse. For example, buying (selling) right before the price goes down (up) usually means the market timing for the trade was sub-optimal. Not surprising, adverse selection is very common for trades that take place while the Signal is on.
[3] Most exchange volume on the bid/offer is displayed, but because we are using TAQ data, we are unable to explicitly isolate displayed vs non-displayed fills. As a result, these measurements necessarily include some portion of dark executions across the board.
[4] Trades at prices below $1 were excluded from the analysis.
[5] To isolate D-Limit trades specifically, we calculated IEX markouts using our own data and compared them to the IEX markouts using TAQ, to be sure that they were sufficiently comparable. We found that IEX markouts look virtually identical regardless of the data source (see Appendix A below for charts showing a comparison of markouts calculated using IEX vs. TAQ data). This gives us confidence that IEX’s own data can be used and the results hold, at which point we isolated D-Limit executions using IEX’s own data.
Appendix A: Comparison of markouts calculated using IEX vs. TAQ data (Q4 2020).


Co- Founder and Chief Operating Officer, IEX Group