
Volume-based metrics — in which volume is the “denominator” in the fraction — have become too inconsistent to use effectively in 2020.
Since the volatility in March, we have witnessed extremely elevated volume that has persisted even as volatility subsided. But it is not just that total volumes are higher than they were previously. The composition of this increased volume is vastly different than the baseline volume we saw in January.
This shift means that we cannot draw conclusions about today’s trading based on an assumption that the volume we are seeing now is just a scaled-up version of what we were used to seeing before March.
In this post, we delve into the composition of this increased volume and why investors should be wary of conclusions drawn from overall market volume.
Volume Metrics Recap
Volume is a critical input for anyone that measures their market share or uses volume-based metrics to gauge the amount of activity driving a stock move.
Pre-2020, the composition of market volume was relatively consistent and predictable. This means that investor participation, while not immediately identifiable, was a stable portion of the market. However, in 2020 we have seen a dramatic shift in the size of certain traditionally smaller parts of the market, namely ETFs, sub-dollar stocks and retail.
Our measure of conventional trading volumes[1], which includes nearly all single-stock volume except off-exchange retail, went from 65% of the market before the March volatility down to 55% of the overall market in June. While overall market volume ballooned 75% from January to June.
This shift indicates that nonconventional trading has picked up dramatically and now accounts for a large portion of the increased volume. The composition of today’s market volume is clearly different from what we experienced in January, and we should adjust our interpretations of the data accordingly.

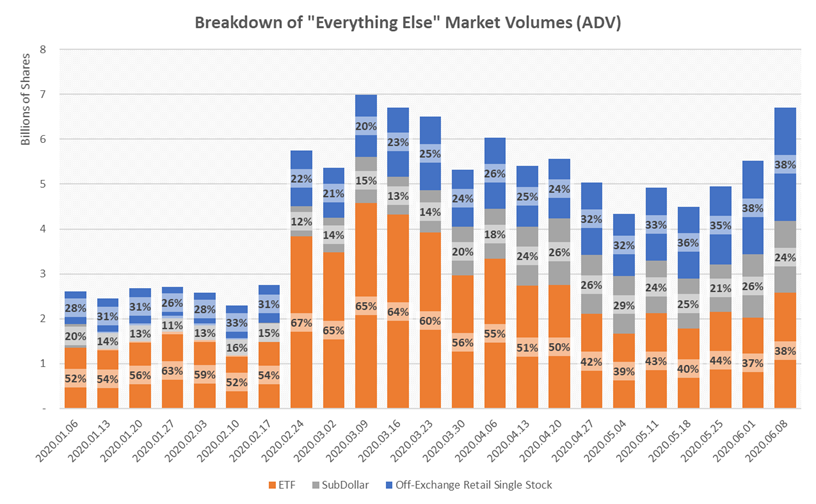
What makes up the nonconventional “Everything Else” that is elevating market volumes?
While the composition of conventional volume has remained relatively consistent, composed largely of single stocks priced above $1, the composition of the increased “everything else” volume has changed throughout the year. In the original volume spike in March, higher nonconventional volume was mostly ETF-driven, but as we enter June, we see heightened activity in retail and sub-dollar stocks.
This breakdown demonstrates just how different the market composition looks week to week in 2020 and how incomparable volumes can be. Note, the retail volume we track only accounts for off-exchange retail volumes, so this estimate is conservative as a portion of retail activity is traded on exchange.
Retail — Still on the Rise
As we know, retail volume saw an increase as most discount retail brokers went to $0 commission in 2019, and people stuck at home during the COVID-19 pandemic turned to trading.
The Trade Reporting Facility (TRF), which reports off-exchange trading volumes, most of which is retail, has hit record high volume days consistently since March. Since most retail trades off-exchange and is only reported to FINRA on a two-week lag, it makes figuring out what part of the daily volume increase is due to retail particularly tricky.

As of early June (our latest data at the time of writing), we can see that aggregate off-exchange retail volume has been steadily climbing all year and now accounts for over 29% of volume. If this retail trend continues, it could have a lasting impact on the makeup of the overall market.
Rise (and Fall) of ETF Volume
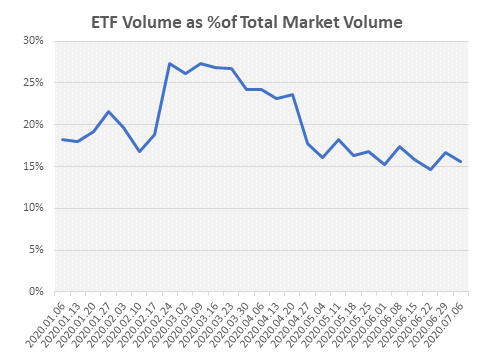
ETF volume skyrocketed in March, jumping from ~17% of the overall market in January all the way up to ~27%. The surge in ETF volume in March was largely driven by the same market participants who make up conventional volumes as defined above, but retail has maintained an increased share of ETFs as volumes have normalized.

Sub-Dollar Volume Explosion
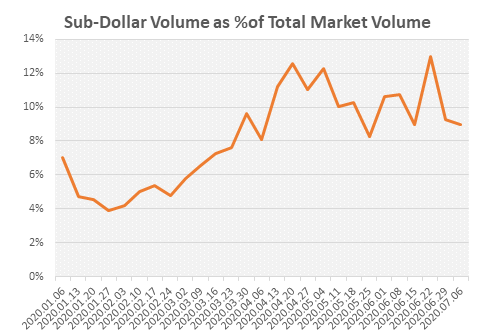
Since the end of March, much of the elevated market volume has been driven by sub-dollar stock growth. On any given day, the overall volume can be skewed by one single sub-dollar name making up a significant portion of the elevated volume. As you can see below, on June 24, SHIP and TOPS, both sub-dollar stocks, together accounted for over 650 million shares of volume and over 5% of overall market volume.

Furthermore, retail trading is a major driver of this sub-dollar surge, suggesting that we may not see this volume skew abate if retail remains a larger part of the market moving forward.

Conclusion — Be Skeptical of Volume!
All volume is not created equal.
We have seen an unprecedented increase in market volume this year. But it isn’t enough to just look at that total number. Investors must pay close attention to the different components of the market volume information they rely on. Any algorithm or conclusion that uses “volume” as an input should take into account structural changes to market composition in order to be useful and effective in today’s market.
[1] We define conventional volume as all volume of a given security classification (single stock, ETF, > $1) less any retail off-exchange volume.